What is the ELK Stack, and what does each part do?
Elasticsearch stores and indexes the data and answers searches, Logstash ingests and transforms it, and Kibana is the web UI for searching and visualising it. Lightweight shippers called Beats were added later, which is why it is now called the Elastic Stack.
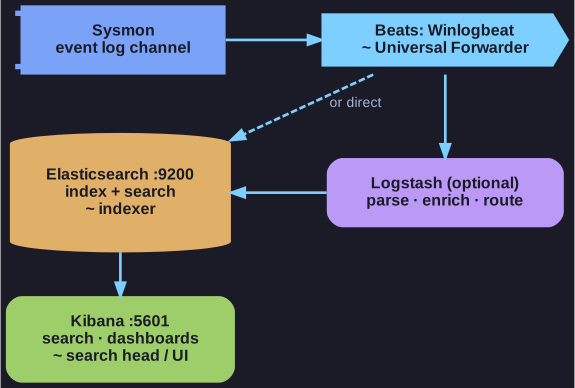
* The same roles as in Splunk: shipper, store and search, user interface. *
| Component | Role | Splunk equivalent |
|---|---|---|
| Beats (e.g. Winlogbeat, Filebeat) | Lightweight agents that ship data from hosts | Universal Forwarder |
| Logstash | Ingest pipeline: parse, enrich, transform, route | Parsing at index time |
| Elasticsearch | Distributed search engine and document store | Indexer |
| Kibana | Search, dashboards, visualisation | Search head / web UI |
For the Sysmon lab the path is: Sysmon writes events → Winlogbeat reads the Microsoft-Windows-Sysmon/Operational channel → Elasticsearch indexes them → Kibana searches them. Newer versions replace much of this with the Elastic Agent and "integrations", added from Kibana's Add integrations screen.
Unlike Splunk, Elasticsearch parses documents into fields when they are indexed (schema on write). Searches are fast and structured, but fields must be defined correctly when the data comes in.
Go deeper:
 Elastic — What is the ELK Stack? — the components and how they fit together.
- Elasticsearch — Wikipedia — the search engine at the centre, and its licensing history.
- Kibana — Wikipedia — the web UI and what it visualises.