Question
The user-visible response time of a distributed application is produced by a dozen systems together — how can monitoring attribute it to the individual components?
Answer
By tagging each request with an identifier at the point of entry and propagating it through every component, so each step reports its own share of the total and the end-to-end path can be reassembled afterwards.
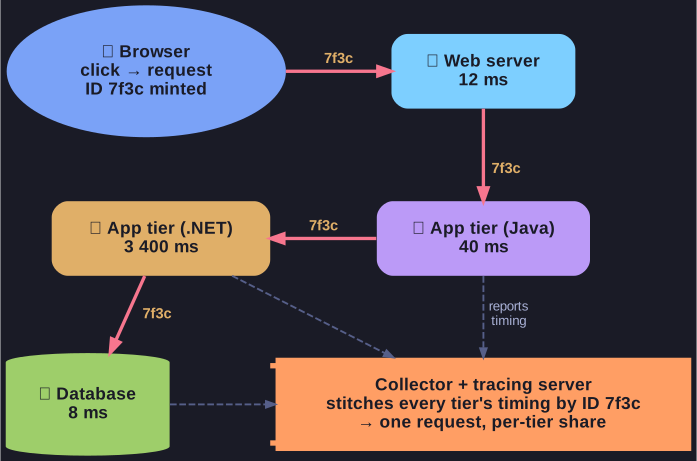
* One request, one ID, five tiers: each reports its own timing, the collector reassembles the path — and 3.4 s of the 3.46 s belong to a single tier. *
The problem first. Business cares about one thing: did the transaction work, and how long did it take? But the transaction is served by a distributed system — browser, web server, application tiers in Java or .NET, a database, some external services. Monitoring each of those in isolation tells you every component is within its own thresholds, and still leaves you unable to say which of them consumed the three seconds the user waited.
The solution is to make the request, not the machine, the unit of observation:
- An identifier is attached when the request enters the system.
- It is passed along with every downstream call — HTTP header, message property, database context.
- Every component records its own timing against that identifier.
- Afterwards, all the records sharing the identifier are assembled into the complete path of that one request, with the time each tier contributed.
Commercial application performance monitoring tools built this early — Dynatrace's PurePath stitches one request across browser, web server, Java, .NET and database tiers — and the same idea, standardised and vendor-neutral, is what distributed tracing in OpenTelemetry does today. Once you have it, "the system is slow" becomes "Service B spends 3.4 seconds waiting on one query", which is an actionable statement.
Go deeper:
 Dynatrace — PurePath — the commercial per-request tracing described here, in the vendor's own words.
- Google — Dapper, a Large-Scale Distributed Systems Tracing Infrastructure — the 2010 paper that defined trace IDs, spans and sampling for distributed systems.
Note saved — thanks!
Question
What does error earliest=-1d@d latest=-1h@h mean in Splunk, and how does "snapping" work?
Answer
Events containing "error" from yesterday at midnight until the start of the current hour: -1d@d means go back one day, then round down to the start of that day; -1h@h means go back one hour, then round down to the full hour.
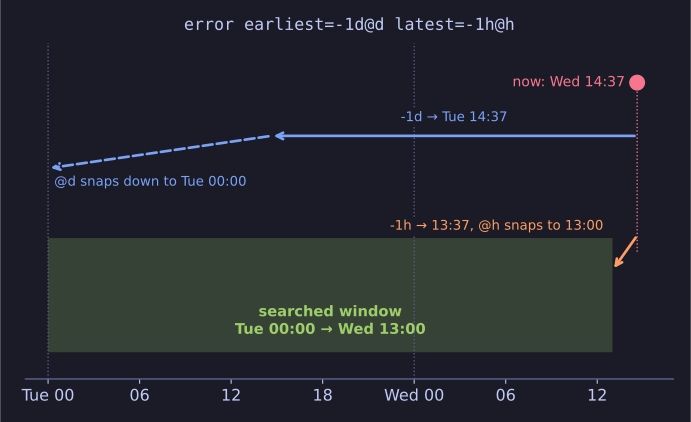
* Go back, then round down: the window is whole days and hours, not rolling. *
Relative time modifiers have the form [+|-]<integer><unit>@<snap_unit>:
- Units:
sseconds,mminutes,hhours,ddays,wweeks,monmonths,qquarters,yyears. The integer defaults to 1, somequals1m. - Snapping (
@) rounds down to the start of the given unit. At 11:59,@hsnaps to 11:00, not 12:00. - Weekdays:
@w0snaps to Sunday,@w1to Monday, and so on.
Worked example, if it is now 14:37 on Wednesday:
| Modifier | Resolves to |
|---|---|
-1d@d |
Tuesday 00:00 |
-1h@h |
Wednesday 13:00 |
@w1 |
Monday 00:00 of this week |
Snapping makes reports reproducible: "yesterday" means the whole calendar day regardless of when the search runs, instead of "the last 24 hours from right now".
Go deeper:
- Splunk — Specify time modifiers in your search — the full syntax, including snapping to weekdays.
Note saved — thanks!