You time a sorting implementation and each doubling of the input size roughly quadruples the runtime. What does that tell you?
That it is quadratic: for $T(n) = c\,n^2$, doubling $n$ multiplies the time by $2^2 = 4$, and the measured ratio 4 is the empirical fingerprint of $O(n^2)$.
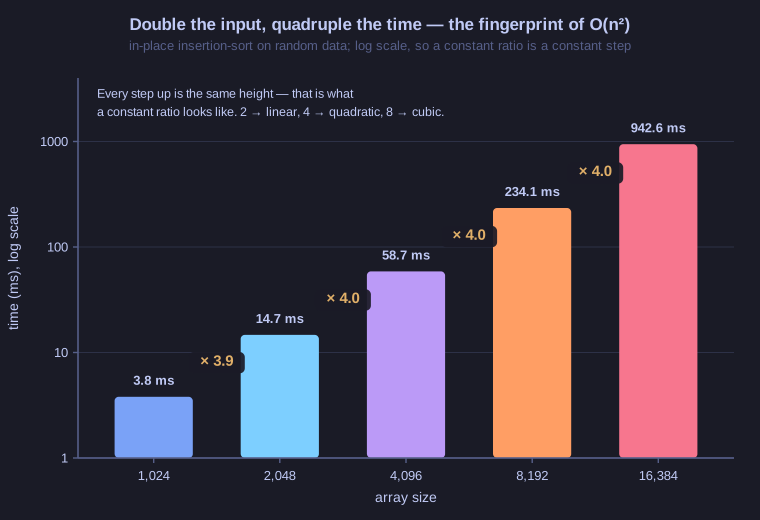
* On a log scale a constant ratio is a constant step — and these steps are all ×4. *
Measured times for an in-place insertion-sort on random data:
| Array size | Time | Ratio to previous |
|---|---|---|
| 1,024 | 3.8 ms | — |
| 2,048 | 14.7 ms | 3.9 |
| 4,096 | 58.7 ms | 4.0 |
| 8,192 | 234.1 ms | 4.0 |
| 16,384 | 942.6 ms | 4.0 |
The doubling ratio reads off the growth class directly, because the constant $c$ cancels in $T(2n)/T(n)$:
| Class | Ratio when $n$ doubles |
|---|---|
| $O(\log n)$ | ≈ 1 (grows by a constant amount) |
| $O(n)$ | 2 |
| $O(n \log n)$ | slightly more than 2 |
| $O(n^2)$ | 4 |
| $O(n^3)$ | 8 |
| $O(2^n)$ | squares — astronomically worse |
Why this is the right experiment: it needs no knowledge of the machine. Absolute milliseconds are meaningless across hardware, but the ratio is dimensionless — the constant factor divides out, leaving only the exponent. That is asymptotic analysis observed from the outside.
Tip: when benchmarking on a JVM, run the measurement in interpreter mode (java -Xint) or with a proper warm-up. Otherwise the JIT compiler optimises the hot loop partway through the run and the ratios come out distorted.
Go deeper:
 Big-O Cheat Sheet — the growth chart plus best/average/worst for every sort worth knowing.