Write PromQL queries for a Windows Server dashboard: CPU usage in percent, RAM usage, network traffic and disk usage.
CPU: 100 minus the idle rate. RAM: total minus free. Network: rate() of the byte counters. Disk: size minus free per volume, or the fraction used.
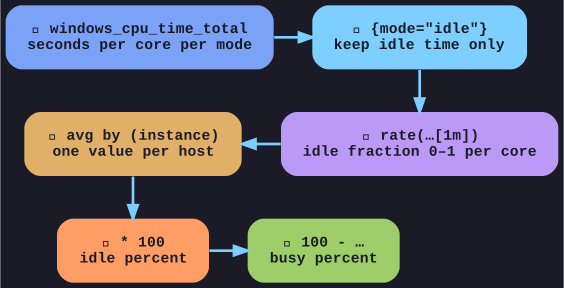
* From a per-core idle counter to one busy-percent number per host. *
# CPU usage in %, averaged over all cores
100 - (avg by (instance) (rate(windows_cpu_time_total{mode="idle"}[1m])) * 100)

# RAM used in bytes
windows_cs_physical_memory_bytes - windows_os_physical_memory_free_bytes

# Network throughput in bytes/s
rate(windows_net_bytes_received_total[1m])
rate(windows_net_bytes_sent_total[1m])

# Disk: used fraction per volume
1 - windows_logical_disk_free_bytes / windows_logical_disk_size_bytes
The reasoning behind the CPU query: windows_cpu_time_total counts the seconds each core spent in each mode. rate() of the idle mode is the fraction of each second a core was idle (0 to 1). Average it over the cores, multiply by 100, subtract from 100, and you have the busy percentage. The same pattern works on Linux with node_cpu_seconds_total{mode="idle"}.
Metric names drift between exporter versions. Newer Windows Exporter releases moved the memory metrics to windows_memory_physical_total_bytes and windows_memory_physical_free_bytes. The Metrics Explorer shows what your version offers.
Go deeper:
 windows_exporter — cpu collector — windows_cpu_time_total and its modes, with example queries.
- windows_exporter — memory collector — the current physical-memory metric names and a usage-percent query.
- Robust Perception — Understanding machine CPU usage — the same idle-rate idea on Linux.