Why does a RED dashboard show the 95th and the 99th percentile latency in addition to the average?
Because an average hides the slow minority: p95 and p99 say how long the slowest 5% and 1% of requests take, which is what users at the edge actually experience.
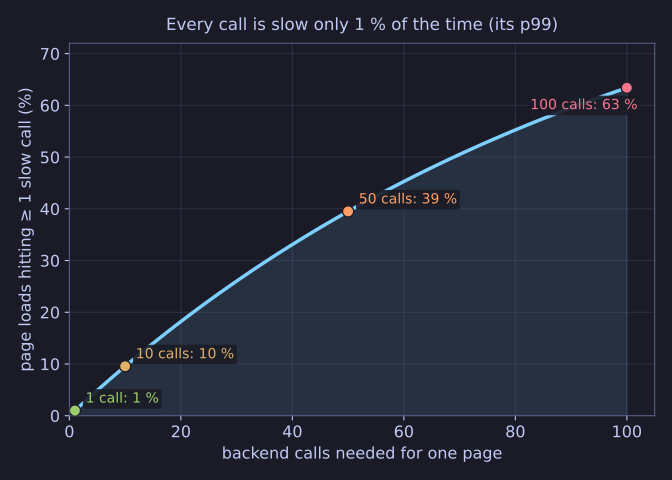
* A service's p99 is rare per call but common per page once a page needs many calls. *
Picture 100 requests: 95 take 50 ms, 5 take 3 seconds. The average is about 200 ms, which looks acceptable and describes no request that actually happened. The p95 sits at the boundary to the slow group, and the p99 lies right inside it: 3 seconds, which is what five of your users just sat through.
Each percentile answers a different question:
- Average: useful for capacity and cost ("how much work do we do"), poor for user experience.
- p95: the typical bad experience; a good default for dashboards and SLOs.
- p99: the tail. It often exposes problems that only hit some requests, such as a cold cache, a lock, garbage collection pauses or one slow database shard.
The tail matters more in microservices than it seems. If a page needs 10 backend calls and each has a 1% chance of being slow, about 10% of page loads hit at least one slow call. A service's p99 quickly becomes the user's p90.
Go deeper:
 Dean & Barroso — The Tail at Scale — Google's classic paper on why tail latency dominates in fan-out systems.
- Prometheus — Histograms and summaries — how percentiles are actually computed from latency buckets.
 Percentile — Wikipedia — definition and the different ways to calculate one.