Quiz Entry - updated: 2026.10.01
What is the /metrics endpoint of an exporter, and how is a Prometheus metric built?
/metrics is the HTTP page Prometheus scrapes. It lists every metric as plain text: a name, optional labels in braces and the current value, with # HELP and # TYPE lines describing it.
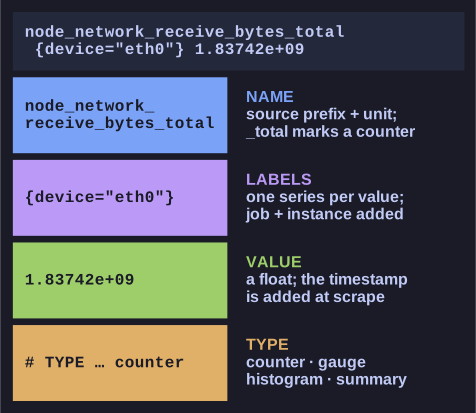
* Name, labels, value, type: the four parts of every metric. *
An excerpt from a Node Exporter:
# HELP node_load1 1m load average.
# TYPE node_load1 gauge
node_load1 0.42
# HELP node_network_receive_bytes_total Network device statistic receive_bytes.
# TYPE node_network_receive_bytes_total counter
node_network_receive_bytes_total{device="eth0"} 1.83742e+09
The parts:
- Name: what is measured, by convention with a prefix for the source (
node_,windows_) and a unit suffix (_bytes,_seconds,_totalfor counters). - Labels: key-value pairs that split one metric into series, e.g. one per network device. Prometheus adds
jobandinstancelabels when it scrapes. - Value: a floating-point number. Prometheus attaches the scrape timestamp when storing it.
- Type: counter, gauge, histogram or summary. Counters only go up; gauges go up and down.
The endpoint is human-readable, so opening http://host:9100/metrics in a browser is the quickest check that an exporter works.
Go deeper:
 Prometheus — Exposition formats — the exact text format, HELP and TYPE lines included.
- Prometheus — Metric and label naming — prefixes, base units and the _total suffix.