What is the difference between automatic (zero-code) and manual instrumentation with OpenTelemetry, and why do most real services use both?
Automatic instrumentation hooks into common libraries and produces spans and metrics without code changes; manual instrumentation means adding spans and attributes in your own code for the business logic only you understand.
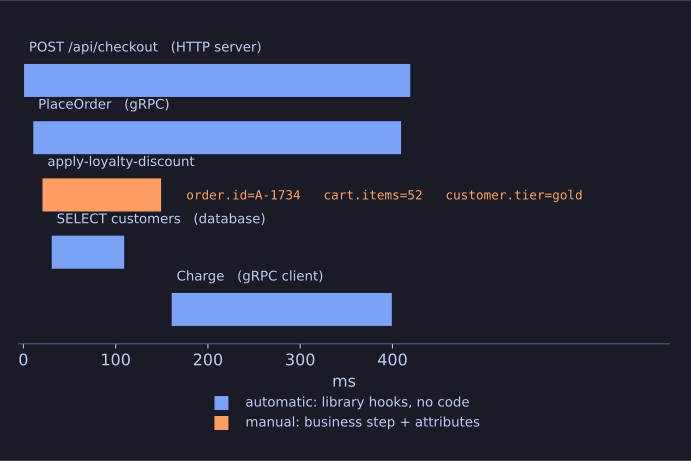
* Library hooks give the skeleton; one manual span adds the business meaning. *
| Automatic (zero-code) | Manual (code-based) | |
|---|---|---|
| How | Agent, library wrapper or environment variables | OpenTelemetry API calls in the application |
| What it captures | Incoming/outgoing HTTP and gRPC calls, database queries, messaging | Business steps, domain attributes (order ID, cart size, customer tier) |
| Effort | Minutes | Ongoing developer work |
| Blind spots | Anything that happens inside your own functions | Only what someone thought to instrument |
Automatic instrumentation gives the skeleton of every trace: the frontend called checkout, checkout called payment, this SQL query took 80 ms. It also propagates the trace context, so the chain holds together. What it cannot know is that a span represents "apply loyalty discount" or that the slow requests all belong to customers with more than 50 items in the cart. That meaning comes from manual spans and attributes.
The Astronomy Shop uses both, which is part of its teaching value: its traces contain library-generated HTTP spans alongside hand-written ones such as getAdsByCategory.
Go deeper:
 OpenTelemetry — Instrumentation concepts — zero-code versus code-based instrumentation.
- Instrumentation (computer programming) — Wikipedia — the general idea of adding measurement code to software.