Quiz Entry - updated: 2026.10.01
What is the difference between a counter and a gauge, and why does that matter for queries?
A counter only goes up (it resets to 0 on restart), like total bytes received. A gauge can go up and down, like current RAM in use. You almost always wrap a counter in rate(); a gauge you read directly.
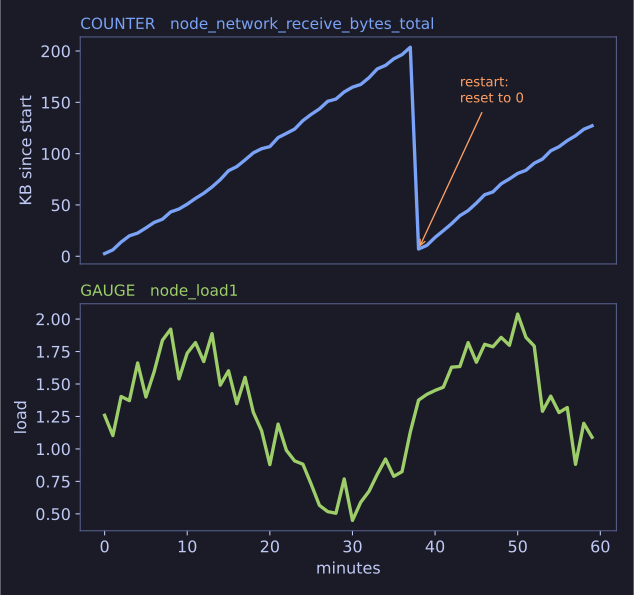
* A counter only climbs (until a restart resets it); a gauge moves both ways. *
| Counter | Gauge | |
|---|---|---|
| Behaviour | Only increases; resets on restart | Rises and falls |
| Naming | Usually ends in _total |
No suffix rule |
| Example | node_cpu_seconds_total, windows_net_bytes_received_total |
node_load1, node_memory_MemAvailable_bytes |
| Raw value tells you | Almost nothing ("1.8 GB since boot") | The current state |
| Typical query | rate(x[1m]) |
x, avg(x), x > 90 |
The raw value of a counter grows forever and is meaningless on a graph. What you want is how fast it grows, which is what rate() computes.
The other two types are histogram and summary, which record distributions (e.g. request durations in buckets) for percentiles.
Go deeper:
 Prometheus — Metric types — counter, gauge, histogram and summary.
- Robust Perception — How does a Prometheus Counter work? — resets and why rate() copes with them.