What does rate(windows_net_bytes_received_total[1m]) compute, and what does the [1m] mean?
[1m] selects every sample of the counter from the last minute (a range vector). rate() turns that into the average per-second increase over the window. Here: received bytes per second, so network throughput.
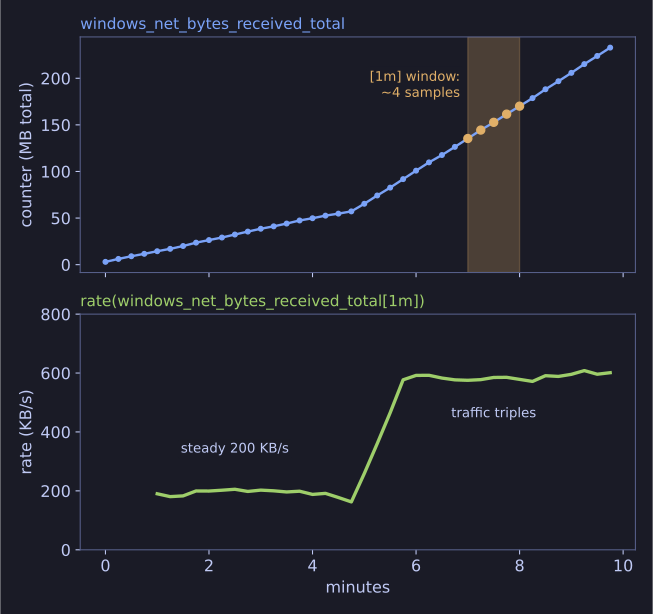
* The window grabs the last minute of samples; rate() turns their rise into bytes per second. *
Step by step:
windows_net_bytes_received_totalis a counter: total bytes received since the exporter started, one series per network interface.[1m]makes it a range vector: for each series, all samples from the last minute instead of only the newest one.rate()takes the increase across that window and divides it by the window length in seconds, giving a per-second rate. It also handles counter resets: if the value drops (exporter restart), it treats that as a reset rather than negative traffic.
The window trades responsiveness for smoothness. [1m] reacts quickly but is spiky; [5m] is smoother. It must span at least two scrapes; with the default 15-second scrape interval, one minute holds about four samples.
Grafana's Explore view suggests rate() automatically when you pick a counter such as node_cpu_seconds_total, for exactly this reason.
Go deeper:
 Prometheus — Query functions: rate() — the definition, with the advice to use it on counters only.
- PromLabs — How exactly does PromQL calculate rates? — extrapolation and counter resets explained with diagrams.