What are the three pillars of observability, and what is each one good and bad at?
Metrics are cheap aggregate time series, logs are detailed individual events, and traces follow one request across services — each is strong exactly where the others are weak.
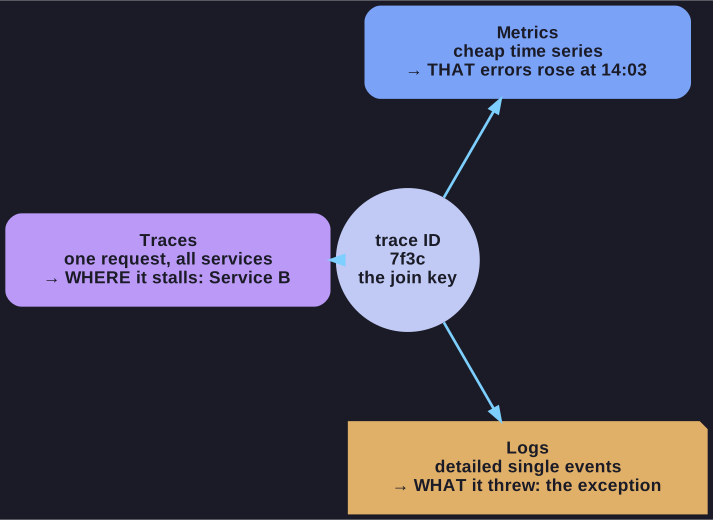
* Three signals, one join key: without a shared trace ID they stay three separate piles. *
| Pillar | What it is | Examples | Strong at | Weak at |
|---|---|---|---|---|
| Metrics | Quantitative time-series data | CPU and memory utilisation, requests per second, response times, error rates | Trends, dashboards, alert thresholds; cheap to keep for a long time | No detail — you see the rate rose, not which request failed |
| Logs | Detailed records of individual events | Error messages, exceptions, user actions, system events ("could not open database connection") | Detailed root-cause analysis, traceability of what happened | Volume and correlation — hard to join across services at scale |
| Traces | The end-to-end path of a request across services | User → API gateway → Service A → Service B → database | End-to-end view, service dependencies, finding bottlenecks | Sampling — usually not every request is recorded |
The workflow they support in combination is the point: a metric shows that the error rate rose at 14:03, a trace shows which service in the chain the failing requests stall in, and its logs show the exception that service threw. Any one pillar alone leaves you guessing at the other two steps — which is why the correlation key (a shared trace ID on log entries and metric exemplars) matters more than any individual pillar.
For traces specifically, the key figure is latency per service — how much of the user's wait each hop contributed.
Go deeper:
 OpenTelemetry: Metrics — counters, gauges and histograms, and how metrics link to traces through exemplars.