What are the stages of a monitoring architecture, and what happens at each one?
Monitored systems → data collection → monitoring platform → analysis and rules → dashboards and alerting: metrics are gathered, stored as time series, correlated, evaluated against rules, then shown or sent to a human.
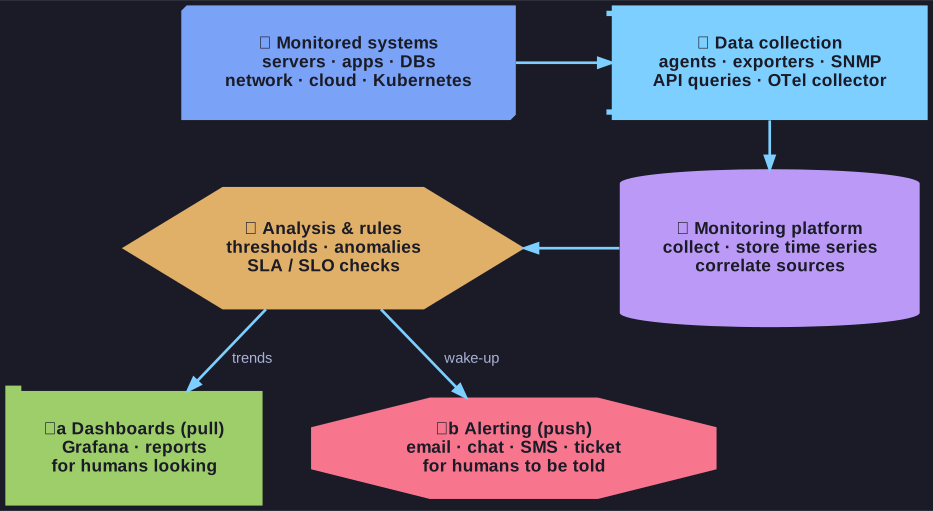
* From monitored systems to the two outputs: dashboards are pull, alerts are push. *
- Systems to be monitored — servers and VMs, applications, databases, network devices, cloud services, containers and Kubernetes.
- Data collection — monitoring agents, exporters, SNMP, API queries, an OpenTelemetry collector. This is where the agent-based / agentless decision lives.
- Monitoring platform — collects the metrics, stores the time-series data, and correlates across sources.
- Analysis and rules — thresholds, anomaly detection, SLA/SLO checks. The platform stores numbers; this stage decides which numbers mean something.
- Output, in two branches — dashboards (Grafana, reports) for humans looking, and alerting (email, chat, SMS, ticket system) for humans who need to be told.
The split at the end is the important bit of the design: dashboards are pull, alerts are push. A dashboard nobody has open cannot wake anyone, and an alert cannot show a trend. Systems that only do one of the two fail in predictable ways — pure dashboards mean incidents are found by whoever happens to be looking, pure alerting means nobody ever notices the slow degradation that never crosses a threshold.
Go deeper:
 Richard Hartmann — Monitoring with Prometheus and Grafana (DENOG16) — 30 minutes on alerting without pager fatigue and how a pull-based platform differs from legacy monitoring.
 Prometheus — Overview — the reference open-source implementation of this architecture, including its pull-based scraping design.