What are the stages of a logging pipeline, from a line written on a server to a chart on a dashboard?
Sources → collection → transport → normalisation → storage → analysis: each stage has one job, and the reason for the chain is that raw log lines from many systems are unusable until they are unified and indexed.
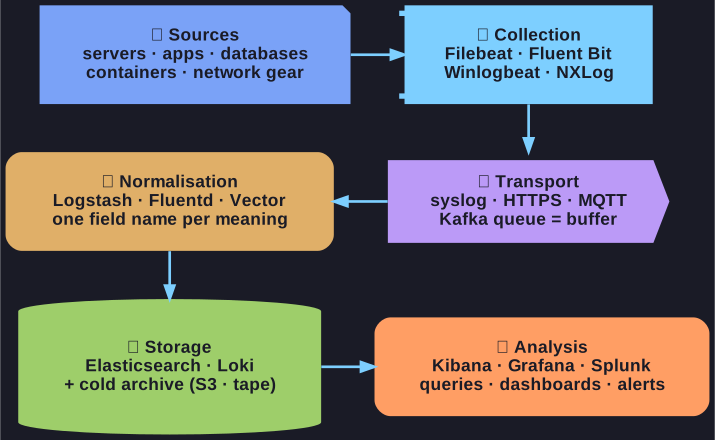
* Six stages, one job each: the queue keeps the platform alive under a spike, normalisation is what makes cross-system correlation possible. *
- Sources — servers, applications, databases, containers and Kubernetes, network devices.
- Collection (collectors / shippers) — an agent on the device picks the entries up: Filebeat, Fluent Bit, Winlogbeat, NXLog.
- Transport — the entries travel: syslog, HTTPS/API, MQTT, or a message queue such as Kafka. A queue is what keeps the pipeline from losing data when the indexing tier is slow or down.
- Normalisation (parsing and structuring) — Logstash, Fluentd or Vector turn each vendor's shape into common field names, so
srcip,source_addressandclient.ipbecome one field. - Storage — an index for fast search (Elasticsearch, OpenSearch, Loki) plus a cheap long-term archive (S3, NAS, tape) for the retention tail.
- Analysis and visualisation — Kibana, OpenSearch Dashboards, Grafana or Splunk for querying, dashboards and alerts.
What you get out of the chain is four distinct uses: root-cause analysis, security monitoring (the pipeline feeding a SIEM), audit evidence and forensics, and business insights pulled out of application data.
Tip: the two stages people skip are transport buffering and normalisation — and those are exactly the two that decide whether the platform survives a traffic spike and whether cross-system correlation is possible at all.
Go deeper:
 Elastic Common Schema (ECS) reference — a widely used common field vocabulary: what the normalisation stage normalises to.
 Vector documentation — a modern collector/normaliser that shows the pipeline stages as explicit sources, transforms and sinks.