Quiz Entry - updated: 2026.10.01
What are the components of a Prometheus monitoring stack, and what does each one do?
Prometheus collects, stores and queries metrics; exporters expose metrics on the targets; the Push-Gateway takes metrics from things that can't be scraped; the Alertmanager sends notifications; Grafana visualises.
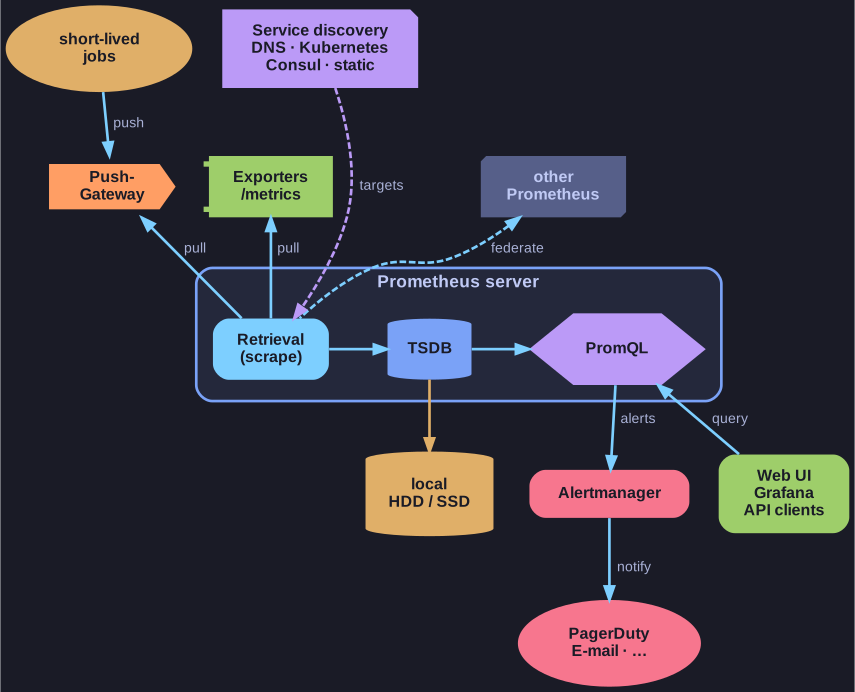
* The Prometheus stack: everything is pulled into the server; alerts go out through the Alertmanager, queries through PromQL. *
| Component | Role |
|---|---|
| Prometheus server | The TSDB. Scrapes targets, stores the data on local disk (ideally SSD), evaluates alert rules, answers PromQL queries. |
| Exporters | Small programs on the monitored systems that expose metrics over HTTP (e.g. Node Exporter for Linux, Windows Exporter). |
| Push-Gateway | A middleman for sources that can't be scraped (short-lived jobs, devices without an exporter). They push to it; Prometheus scrapes it. |
| Service discovery | Tells Prometheus which targets exist: Consul, DNS, Kubernetes, or a static list. |
| Alertmanager | Receives alerts from Prometheus, groups and silences them, and notifies people via e-mail, PagerDuty, OpsGenie and so on. |
| Grafana | Dashboards. Not part of Prometheus itself, but the standard front end for it. |
Prometheus stores data only through the local file system. It cannot natively write to distributed storage such as Ceph.
Go deeper:
 TechWorld with Nana — How Prometheus Monitoring works — a clear 20-minute walk through server, exporters, Pushgateway and Alertmanager.
- PromLabs — Introduction to the Prometheus Monitoring System — key concepts from Julius Volz, one of Prometheus's creators.
 Prometheus (software) — Wikipedia — history (SoundCloud, CNCF) and the architecture at a glance.