What are RED metrics, and how is each of the three measured?
Rate, Errors, Duration: requests per second, the percentage of requests that fail, and how long requests take (as the 95th and 99th percentile and the average). Three numbers per service that cover what its users experience.
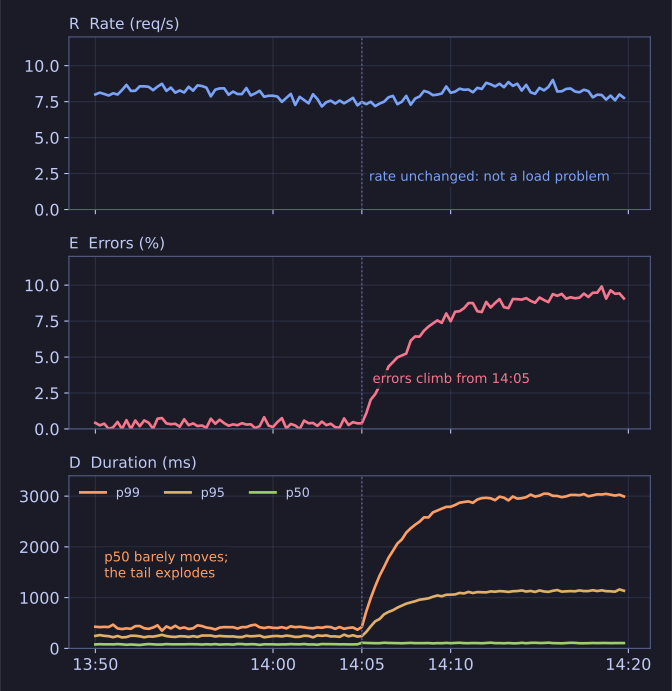
* Read the three panels together: steady traffic, rising errors, a tail that explodes while the median barely moves. *
| Letter | Measures | Typical unit | What it reveals |
|---|---|---|---|
| Rate | Requests handled per second | req/s | Load peaks, user activity, traffic dropping to zero |
| Errors | Share of requests that fail | % | A failing dependency, e.g. the payment service |
| Duration | Time per request | ms, as p95 / p99 / average | Performance problems, slow components |
RED, coined by Tom Wilkie, is aimed at request-driven services: anything that receives requests and answers them. Its strength is uniformity. Every service gets the same three panels, so an engineer who has never seen the payment service can still read its dashboard in seconds.
It is a close cousin of Google's four Golden Signals (latency, traffic, errors, saturation): RED is the golden signals minus saturation. For the resource side (CPU, disk, queue lengths) there is the separate USE method (Utilisation, Saturation, Errors), which is aimed at hardware and resources rather than services.
Tip: RED for services, USE for resources.
Go deeper:
 Grafana Labs — The RED Method: how to instrument your services — Tom Wilkie's own introduction.
- Google SRE Book — Monitoring Distributed Systems — the four golden signals that RED is a subset of.