Walk through a realistic diagnosis with all three observability pillars: users report slow response times — what does each pillar contribute?
Metrics say the infrastructure is fine, the trace shows Service B taking 3.4 seconds, and that service's logs show a slow database query — root cause: a missing database index, found in minutes instead of hours.
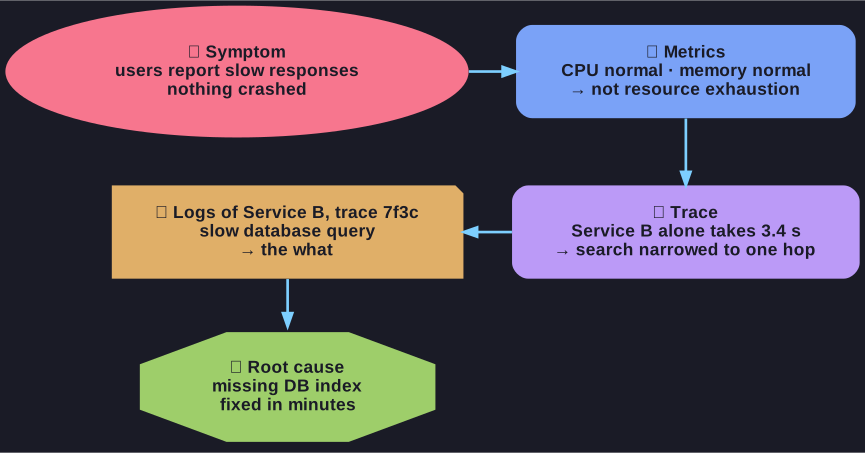
* Each pillar narrows the search: metrics rule out, the trace localises, the logs name the query. *
The sequence, and what each step rules out:
- The symptom — users report slow response times. Nothing has crashed, so availability monitoring is green.
- Monitoring / metrics — CPU normal, memory normal. This is a genuinely useful negative result: it eliminates resource exhaustion and stops the team from adding capacity that would not help.
- Tracing — the trace of a slow request shows the time is not spread evenly: Service B alone takes 3.4 seconds while every other hop is in milliseconds. The search is now narrowed from the whole estate to one service.
- Logging — Service B's logs for that trace ID show a slow database query.
- Root cause — a missing index on the queried table. Add it, and the latency disappears.
Note that no single pillar could have finished the investigation. Metrics knew something was wrong but not where; traces knew where but not what; logs knew what but would have been unfindable without the trace to point at the right service and the right moment. The benefit is measured in the time saved: minutes instead of hours, which is MTTR expressed as a number.