The Astronomy Shop's service dependency graph shows frontend-proxy → frontend with about 2,700 calls, frontend → product-catalog with about 940, but frontend → checkout with only 5. What does that tell you?
A dependency graph's edges count real calls, so it shows the traffic mix: visitors (and the load generator) browse the catalogue constantly but place very few orders.
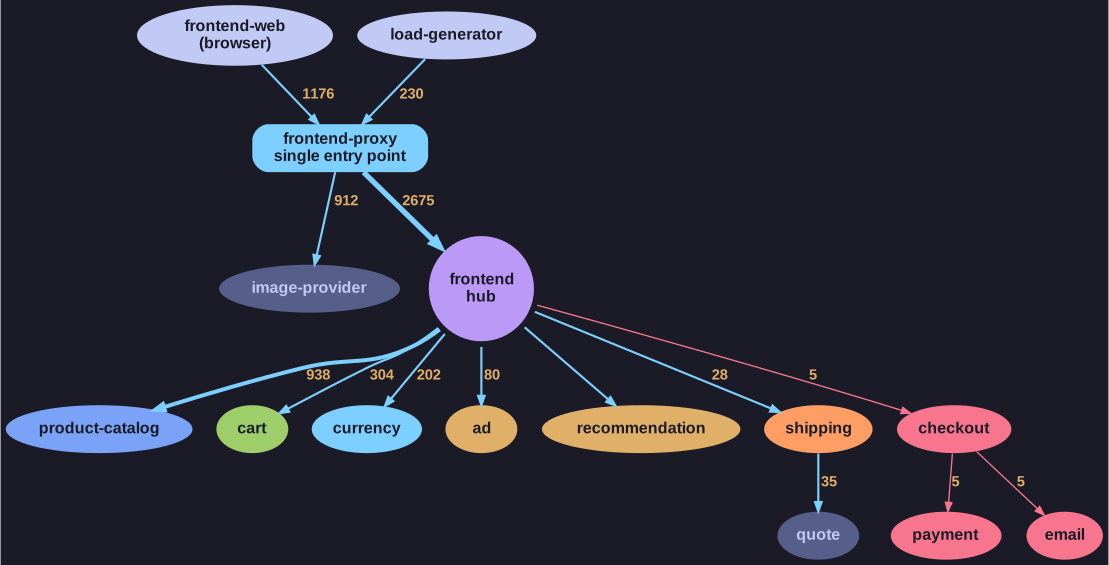
* Edge numbers are observed calls: thousands of catalogue views, five orders, each paid and confirmed once. *
A dependency graph is drawn automatically from traces: every time a span in service A calls service B, the edge A → B gets one more call. Nobody draws it by hand, so it shows the architecture as it actually runs, not as the documentation claims.
Reading the numbers:
- frontend-proxy is the single entry point. Both the real browser (frontend-web, ~1,200 calls) and the load-generator (~230, a script simulating shoppers) arrive there, and it forwards to the frontend and to the image-provider that serves product pictures.
- frontend is the hub, fanning out to product-catalog, cart, currency, ad, recommendation, shipping and checkout.
- checkout was called 5 times, and it called payment and email exactly 5 times each: every order paid and confirmed once.
Two practical uses follow. First, the call counts tell you where load goes: a slowdown in product-catalog affects hundreds of page views, one in checkout affects a handful of orders (though each of those is worth money). Second, an edge that should exist but is missing, or an unexpected one that appears, is a quick sign of a misconfiguration or a failing dependency.
Go deeper:
 OpenTelemetry Demo — Architecture — the full service diagram with languages and protocols.