Quiz Entry - updated: 2026.10.01
Prometheus is poor at keeping years of metrics. How is long-term trending usually solved, and what is downsampling?
Prometheus keeps recent data and writes selected metrics to a second TSDB built for long-term storage, such as InfluxDB or Graphite. Downsampling means averaging data into coarser intervals before storing it long term.
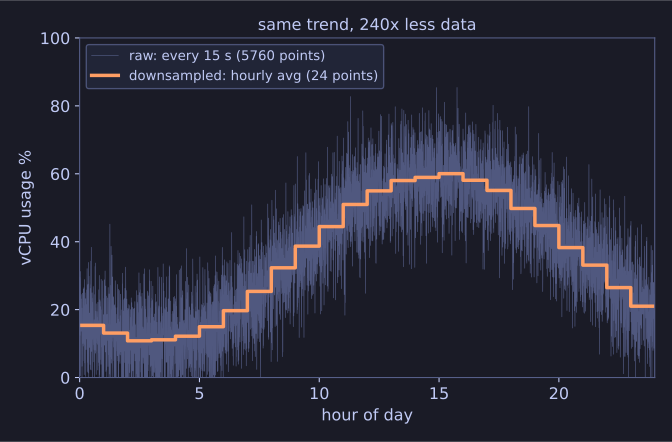
* Same trend, 240 times less data: hourly averages instead of 15-second samples. *
Prometheus gets slow and sluggish when fed historical data for hundreds of hosts going back years. The fix is a division of labour:
- Prometheus uses a storage plug-in (remote write) to send selected metrics to InfluxDB, Graphite, OpenTSDB or Gnocchi.
- Downsample first. Nobody needs a load balancer's 15-second response times from a Saturday three years ago. What matters long term is, say, vCPU and RAM usage per hour or day. Averaging to larger intervals cuts the data volume drastically.
- Data that reached the long-term store is deleted from Prometheus.
- Grafana gets the long-term store as an additional data source, with its own dashboards.
Alerting stays with Prometheus only, so the long-term store is not connected to the Alertmanager.
Go deeper:
 Prometheus — Storage (local and remote) — retention limits and the remote-write integrations for long-term stores.
- Downsampling (signal processing) — Wikipedia — the general technique of reducing sample rate.