Jaeger's Monitor tab ranks a service's operations by "Impact". Why can an operation with a p95 of 2.35 s rank low while one with 1.39 s ranks highest?
Because impact combines latency with request rate: a slow operation that runs rarely costs users less total waiting time than a moderately slow one that runs constantly.
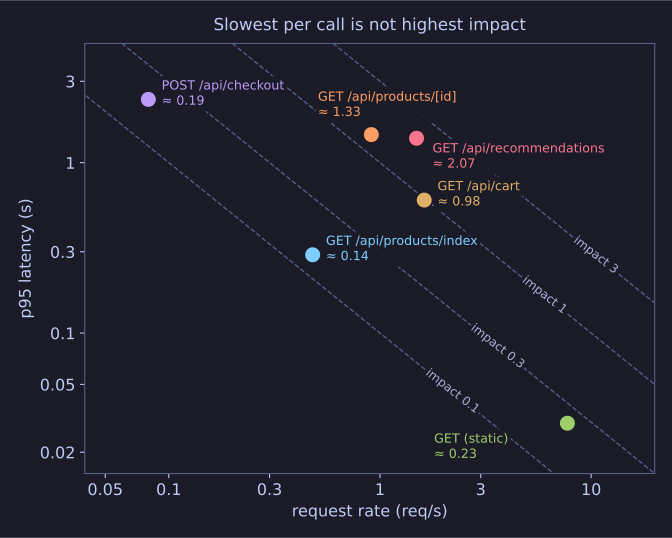
* Impact grows towards the top right: frequent and slow beats rare and slower. *
The Monitor tab aggregates span data per service into RED-style charts (latency percentiles, error rate, request rate) and a table of operations. In the Astronomy Shop's frontend:
| Operation | p95 latency | Request rate | Impact |
|---|---|---|---|
GET /api/recommendations |
1.39 s | 1.49 req/s | highest |
GET /api/products/[productId]/index |
1.46 s | 0.91 req/s | high |
GET /api/cart |
603 ms | 1.62 req/s | medium |
POST /api/checkout |
2.35 s | < 0.1 req/s | low |
Multiply latency by rate and the ranking follows: recommendations ≈ 2.1, product page ≈ 1.3, cart ≈ 1.0, checkout ≈ 0.2. Checkout is the slowest single call, but almost nobody triggers it; recommendations load on nearly every page.
That is the question Impact answers: where would a speed-up save the most user time? It is a prioritisation aid, not the whole truth. A rare operation can still matter more in business terms (checkout is where the revenue is), which is why you read the ranking together with what the operation means.
Go deeper:
 Jaeger — Service Performance Monitoring — the Monitor tab, and Impact defined as latency times request rate.