In distributed tracing, how does the trace ID get from one service to the next, so that all the spans of one request end up in the same trace?
Through context propagation: the calling service puts the trace ID (and its own span ID) into the outgoing request's headers, and the receiving service reads it and makes its new span a child of that one.
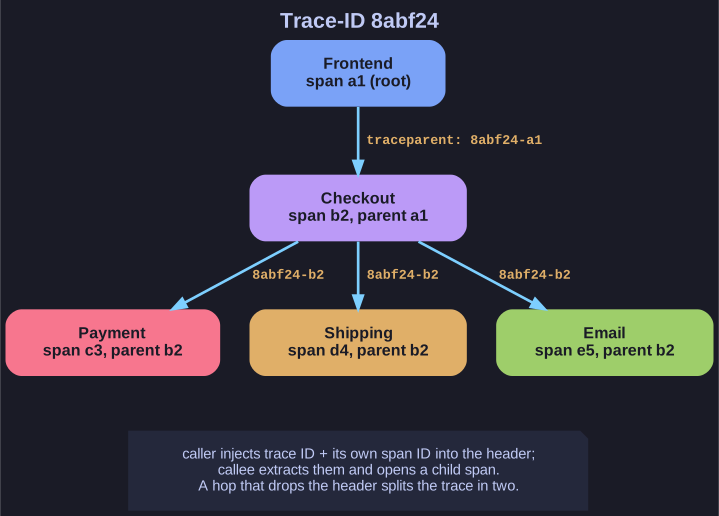
* The header travels with the request; each callee opens a child span of the caller's. *
Each user request receives a unique trace ID at the first instrumented hop. Every unit of work along the way, such as a call from checkout to payment, becomes a span, a timed record with a start, a duration, a status and attributes. For those spans to form one tree, the IDs must travel with the request across process and network boundaries.
On HTTP this is standardised as the W3C Trace Context traceparent header:
traceparent: 00-4bf92f3577b34da6a3ce929d0e0e4736-00f067aa0ba902b7-01
             version-trace-id-parent-span-id-flags
The OpenTelemetry SDKs inject and extract this header automatically for common HTTP and gRPC libraries. The practical consequence: a service that is not instrumented, or a proxy that strips headers, breaks the chain, and the trace splits into disconnected pieces. When a trace in Jaeger mysteriously stops at one service, a lost header is the first suspect.
The resulting tree shows at a glance which services took part, how long each one needed, where errors occurred and where time was spent waiting.
Go deeper:
 OpenTelemetry — Context propagation — how trace context crosses service boundaries.
- W3C Trace Context specification — the
traceparentandtracestateheaders in full. - OpenTelemetry — Traces — spans, span context and parent-child relationships with example JSON.