In a minimal Prometheus setup with a Linux host, a Windows host and a monitoring server, what runs where, and on which ports?
The monitoring server runs Prometheus (port 9090) and Grafana (port 3000); the Debian host runs the Node Exporter (9100); the Windows Server runs the Windows Exporter (9182).
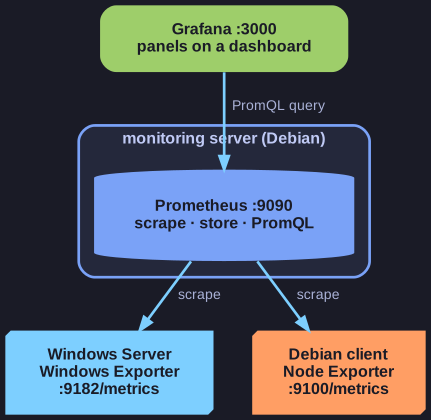
* One monitoring server, two exporters, four ports to remember. *
| Host | Software | Port | Endpoint |
|---|---|---|---|
| Monitoring server (Debian) | Prometheus server | 9090 | web UI, API, /targets |
| Grafana | 3000 | dashboards | |
| Linux client (Debian) | Node Exporter | 9100 | /metrics |
| Windows Server | Windows Exporter | 9182 | /metrics |
The flow: the exporters collect metrics about their own system and offer them on an HTTP endpoint. Prometheus scrapes both endpoints regularly and stores the data. PromQL selects and aggregates the metrics, and Grafana turns the query results into panels arranged on a dashboard.
Two operating systems need two different exporters, but both speak the same Prometheus format, so the server treats them the same way.
Tip: for the Alertmanager it's 9093, for the Push-Gateway 9091.
Go deeper:
 Prometheus — Getting started — the official first setup, scraping itself and querying the result.
 prometheus-community/windows_exporter on GitHub — installation, default port 9182 and the list of collectors.