How is an OpenTelemetry Collector organised internally, and why does that design make routing telemetry easy?
As pipelines of receivers → processors → exporters, one pipeline per signal type; data comes in through a receiver, is transformed by processors, and leaves through one or more exporters.
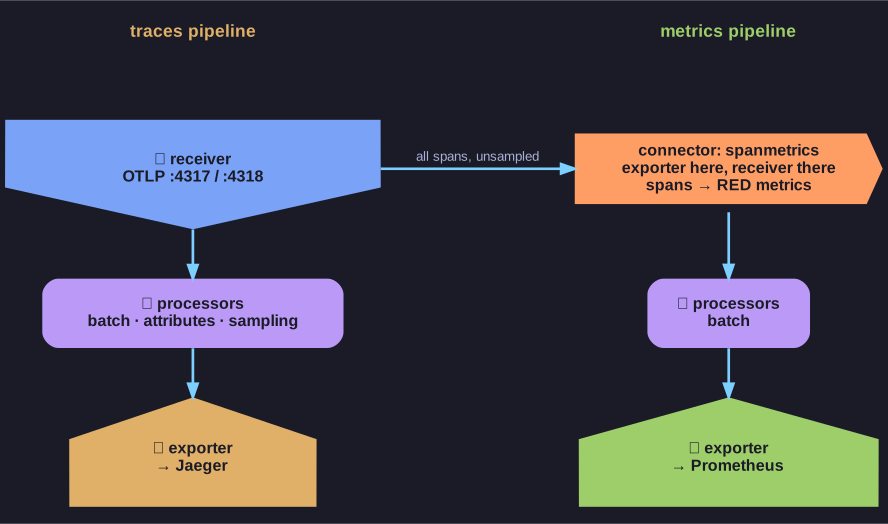
* Each signal flows receiver, processors, exporter; a connector turns one pipeline's output into another's input. *
- Receivers accept data. The standard one is the OTLP receiver (gRPC on port 4317, HTTP on 4318), but receivers can also scrape Prometheus endpoints, read log files, or accept other formats.
- Processors work on the data in flight: batch it for efficiency, drop noisy spans, add attributes such as the deployment environment, cap memory use, or sample.
- Exporters send the result on, for example to Jaeger, to Prometheus, to OpenSearch or to a vendor's cloud.
A pipeline is declared per signal (traces, metrics, logs) in the Collector's YAML configuration. Because an exporter is just an entry in a list, sending the same traces to two backends at once, say during a migration, is a one-line change. There is also a fourth building block, the connector, which is the exporter of one pipeline and the receiver of another; that is how the Astronomy Shop turns spans into metrics.
Go deeper:
 OpenTelemetry — Collector configuration — receivers, processors, exporters, connectors and how pipelines are declared in YAML.