How does telemetry travel from the Astronomy Shop's services to the tools you look at, and what role does the OpenTelemetry Collector play?
Every service sends its traces, metrics and logs to the OpenTelemetry Collector, which acts as the central collection point and forwards each kind of data to the right backend: Jaeger, Prometheus, Grafana, OpenSearch.
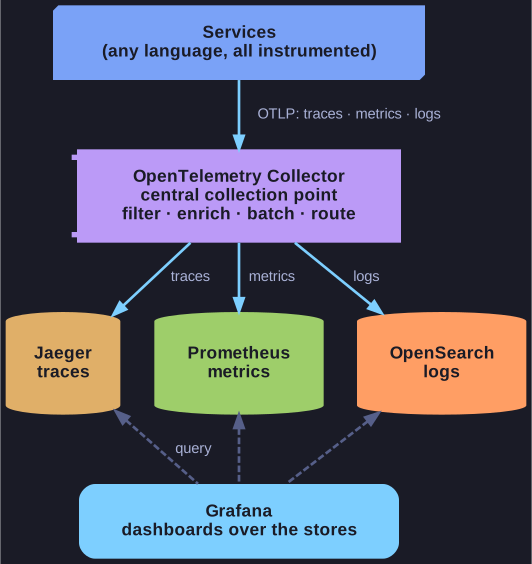
* Services know one destination; the Collector decides where each signal goes. *
The services do not know which monitoring tools exist. They only know one destination, the Collector, and speak one protocol to it (OTLP, the OpenTelemetry Protocol). The Collector then routes each signal:
- traces → Jaeger, for searching and viewing individual requests;
- metrics → Prometheus, a time-series database;
- logs → OpenSearch, a search index for log text;
- Grafana sits on top and draws dashboards from those stores.
Three advantages come from putting the Collector in the middle:
- One uniform interface. Every service, in every language, sends the same format to the same place.
- Decoupling. Swapping Jaeger for another tracing backend, or adding a commercial one, is a change to the Collector's configuration, not to thirteen services' code.
- Central processing. Filtering, enriching (adding the environment or cluster name), batching, sampling and even deriving new data happen once, in one place.
Tip: think of the Collector as a post-sorting centre. Senders drop everything in one box; the sorting centre decides which truck each item goes on.
Go deeper:
 OpenTelemetry Collector documentation — receivers, processors, exporters and pipelines explained.