How does Prometheus learn which hosts to scrape in a large, changing environment, and why is a static list not enough?
Through service discovery: Prometheus asks a registry such as Consul, DNS SRV records or the Kubernetes API for the current list of targets, so new hosts are monitored automatically.
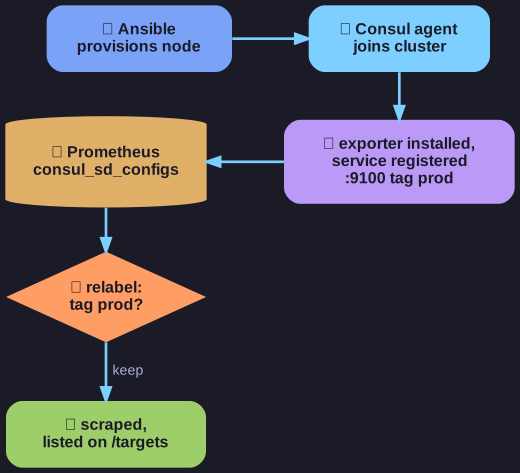
* From provisioning to scraping with no manual step: Consul holds the list, relabeling filters it. *
Classic monitoring keeps target lists in a database or config file. In a platform where hundreds of nodes are added at once, nobody wants to type them in by hand, and forgotten entries mean unmonitored machines.
The Consul approach works like this:
- Consul (a lightweight cluster membership and service registry agent) runs on every host; a new host joins the Consul cluster automatically.
- The automation that installs an exporter (e.g. an Ansible playbook) also registers it in Consul as a service, for example
prometheus-node-exporteron port 9100 with the tagprod. - Prometheus is configured with
consul_sd_configsand fetches the service list from Consul. relabel_configsfilters and labels what comes back, e.g. keep only services taggedprodand set thejoblabel from the service name.
The result: provision a node with Ansible, and its metrics appear in Prometheus with no manual step. The Targets page of the Prometheus web UI shows whether discovery worked.
Go deeper:
 Prometheus — Configuration (consul_sd_config, relabel_config) — every discovery mechanism and the relabel actions.
 Prometheus guide — file-based service discovery — the simplest dynamic alternative to a static target list.
- Consul (software) — Wikipedia — what Consul is and what else it is used for.