Quiz Entry - updated: 2026.10.01
How do you connect Grafana to Prometheus and get a first useful dashboard without building one by hand?
Add Prometheus as a data source (URL http://localhost:9090 when both run on the same host), then import a ready-made community dashboard by its ID, e.g. 1860, "Node Exporter Full".
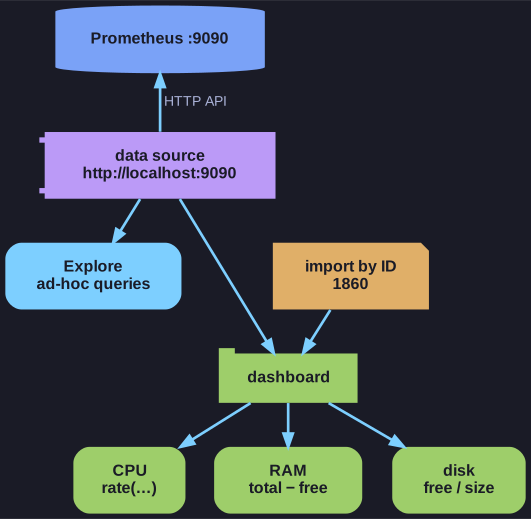
* One data source, then Explore for ad-hoc queries and dashboards whose panels are queries. *
- Log in at port 3000. The initial credentials are
admin/admin, and Grafana forces a password change. - Add a data source: type Prometheus, enter the server's URL, Save & test until it says "Data source is working".
- Explore (compass icon) runs ad-hoc queries without a dashboard, much like Prometheus's own Graph page, with a query builder that can add operations like
rate()and an Explain switch that describes each step. - Import: Dashboards > Import, enter ID 1860 from grafana.com, pick the Prometheus data source. Every panel can then be edited to study or change its query.
Where settings live: server-wide options (port, single sign-on) are in /etc/grafana/grafana.ini. Everything configured in the web UI (data sources, dashboards, users) is stored in Grafana's database, because Grafana is a multi-user application. Plug-ins extend it with new data sources, panel types or apps.
Go deeper:
 Grafana — Prometheus data source — every connection setting.
 Node Exporter Full — dashboard 1860 — the community dashboard, with its panel list and revisions.
- Grafana — Import dashboards — importing by ID, URL or JSON.
- Grafana plugins catalogue — data sources, panels and apps that extend Grafana.