How do structured logs connect to traces in the Astronomy Shop, and why does that connection matter?
Each log entry carries the trace ID of the request that produced it, so from an error log you can jump straight to the full trace, and from a span to every log line written during it.
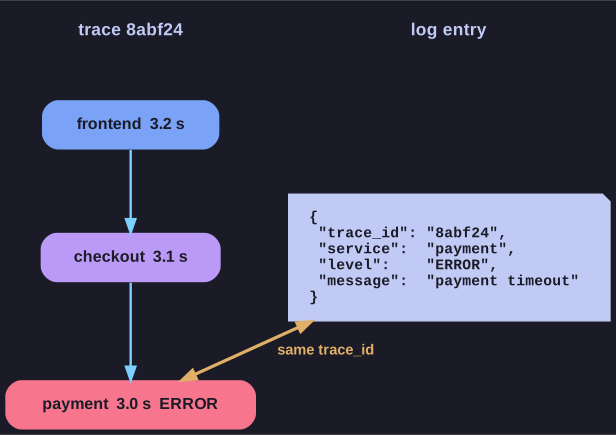
* One shared ID turns a dead-end error line into the full story of the request. *
A structured log from the payment service looks like this:
{
  "trace_id": "8abf24",
  "service": "payment",
  "level": "ERROR",
  "message": "payment timeout"
}
On its own, "payment timeout" is a dead end: which order? which customer? what happened before? Because the entry carries the trace_id, you can open trace 8abf24 and see the whole request: the frontend called checkout, checkout called payment, payment waited 3 seconds on its downstream call and gave up. The reverse direction works too: while looking at a slow span, you can pull up exactly the log lines written during it instead of grepping a log file by timestamp.
This shared ID is what turns three separate pillars (logs, metrics, traces) into one investigation. Without it, correlating them means lining up timestamps across systems by hand, which is slow and often wrong under load. OpenTelemetry's logging integration injects the active trace and span ID into log records automatically.
Go deeper:
 OpenTelemetry — Logs — how log records carry trace and span IDs for correlation.