How can one time series database cover monitoring, alerting and trending, instead of running two separate systems?
The current state of a service is just a time series with a single (latest) element. Add a rule engine that fires when values cross a threshold and monitoring falls out as a by-product of collecting trending data.
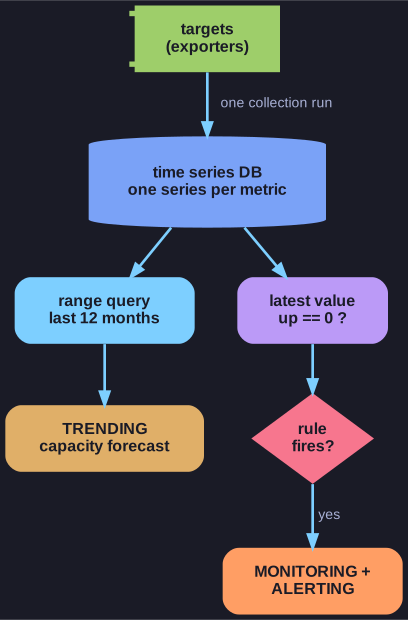
* One collection run, two uses: range queries for trending, latest value plus a rule for monitoring. *
The naive design is two systems: a TSDB for trending and a classic monitor for alerts. That means two environments to maintain, and two systems both hammering every host with requests for the same data.
The trick avoids that. "Is the service up?" is nothing more than "what is the newest value of the up series?" If the TSDB can evaluate conditions on its data and raise an alarm, it is a monitoring system, and the data comes from the same collection run that feeds the graphs.
That is exactly what Prometheus is: a time series database which, with some add-on components, becomes a scalable solution for Monitoring, Alerting and Trending (MAT).
Go deeper:
 Prometheus — Overview — the project's own summary of what it is and when it fits.