A Jaeger trace header reads "Duration 41.0 ms, Services 4, Depth 9, Total Spans 9". How do you read that, and how do you read the timeline below it?
The whole request took 41 ms, touched 4 services, and produced 9 spans nested 9 levels deep, so each span called the next in a straight chain. In the timeline, each bar is a span, indented under its parent, positioned and sized by when it ran and for how long.
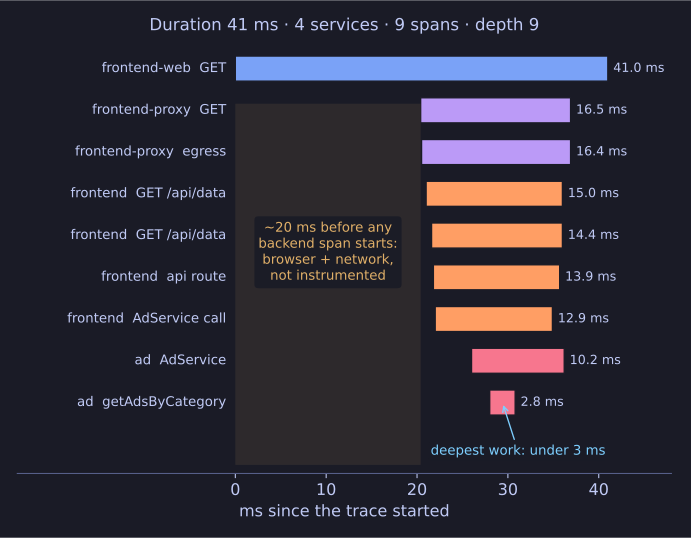
* A real Astronomy Shop trace: half the 41 ms passes before the backend even starts. *
- Duration is the root span's length, the time the user waited for this request.
- Services counts distinct services (here frontend-web, frontend-proxy, frontend, ad).
- Total spans counts every timed operation.
- Depth is the length of the longest parent → child chain. Depth equal to span count means a pure chain with no parallel calls; a trace with 30 spans and depth 4 would be wide and shallow instead, with many calls fanned out from a few parents.
Reading the bars: a parent's bar always covers its children's bars, because it waits for them. So you walk down the tree looking for where time is actually spent. In this example the root span (the browser's request) runs the full 41 ms, but the next span, frontend-proxy, only starts at about 20 ms. The first 20 ms happened before any server-side work began, in the browser or on the network, and the backend accounts for only half the total. The deepest span, getAdsByCategory in the ad service, takes under 3 ms, so the ad lookup itself is not the problem.